
Learn / DaVinci Resolveupdated for DaVinci Resolve 21.0.2 (July 2026)
DaVinci Resolve High GPU Usage but Low FPS: The Real Fix
Quick answer
High GPU usage with low FPS in DaVinci Resolve means the GPU is either genuinely maxed on compute-heavy work like Optical Flow or noise reduction, or its decode engine is pegged on a long-GOP codec while the compute engine idles. Check Task Manager's per-engine graphs, then lower resolution, transcode to proxies, or enable hardware decode.
Your GPU usage meter says 98%. Your timeline says 9 frames per second on a project that should play at 24. Every instinct says the GPU is the bottleneck, so you check for a faster card, and then you notice your card is already a good one. Something doesn't add up.
Nothing is actually broken. Your GPU is telling the truth, just not the whole truth, and DaVinci Resolve is asking it to do two very different jobs that both show up as "GPU usage" on the same meter. One of those jobs, when it's maxed, means your frame rate really is as fast as your hardware can go. The other means your GPU is busy doing almost nothing useful while the actual work waits in line. Telling them apart is the entire fix.
What does "high GPU usage but low FPS" actually mean?
Start with what "GPU usage" is actually measuring, because it isn't one number describing one thing. A modern GPU has several distinct engines living on the same chip: a 3D or compute engine that does the math for color grading, effects, and scaling, a video decode engine that unpacks compressed footage into raw frames, a video encode engine for exports, and sometimes a copy engine for moving data around. DaVinci Resolve can load any combination of these depending on what's actually on your timeline.
Windows Task Manager doesn't average these engines together, and there's a documented reason why. According to the Microsoft DirectX Developer Blog's explanation of GPU reporting, an early design that averaged all engines together produced nonsense results: "The average utilization across engines felt misleading since a GPU with 10 engines, for example, running a game fully saturating the 3D engine, would have aggregated to a 10% overall utilization!" Worse, the same design could hide real activity entirely, since "playing a video under some circumstances may not use the 3D engine at all in which case the aggregated utilization on the GPU would have been reported as 0%" even while the decode engine was working hard. Microsoft's fix was to report whichever single engine is busiest at any given moment as "the" GPU usage number: "Instead we opted to pick the percentage utilization of the busiest engine as a representative of the overall GPU usage."
That design choice is exactly why your Task Manager number can read 98% and still tell you almost nothing about why your timeline is slow. The blog explains the mechanism directly: "A GPU driver may decide to decode a particular media clip using the video decode engine while another clip, using a different video format, might rely on the compute engine or even a combination of multiple engines." A pegged decode engine and a pegged compute engine both read as "98% GPU usage" on the exact same graph, and they call for opposite fixes.
High GPU usage and low FPS are not a contradiction. They are two different ways of describing the same maxed-out chip, and only one of them means your GPU is actually the problem. Once you separate which engine is maxed, the fix usually reveals itself in the next five minutes, not the next five hours of settings changes.
Is Task Manager or Activity Monitor even telling you the truth?
Before you touch a single setting in Resolve, spend two minutes checking which engine your GPU is actually spending its time on. This single check eliminates half the branches on this page.
On Windows:
- Open Task Manager, go to the Performance tab, and click your GPU in the left sidebar.
- You'll see four small graphs, each defaulting to different engines, usually 3D, Copy, Video Encode, and Video Decode, though the exact defaults vary by driver.
- Click the dropdown label under any graph and change it to "Video Decode" if it isn't already shown.
- Play your problem timeline and watch both the 3D/Compute graph and the Video Decode graph at the same time.
If Video Decode spikes toward 100% while 3D and Compute barely move, your GPU is spending its time unpacking compressed footage, not rendering your timeline. If it's the reverse, 3D or Compute pegged while Video Decode stays low, your GPU is doing real render work and the low frame rate reflects genuine compute demand.
On a Mac, the built-in tool is blunter. Larry Jordan, whose editing tutorials predate Resolve itself, walks through Activity Monitor's GPU History window in his guide to monitoring GPU activity: open Activity Monitor, choose Window > GPU History, and you'll get a single scrolling bar graph per GPU. "The higher the light blue bar, the harder the GPUs are working," Jordan notes, describing exactly what happened when he graded 4K footage with LUTs applied: "The GPUs suddenly became busy during rendering, but not playback." That's useful, but it's also the whole limitation in one sentence. Apple's own support documentation for viewing GPU activity in Activity Monitor describes the same single aggregated graph, with no per-engine breakdown at all, just density: "If you see many tall blue bars packed tightly together, consider using an external GPU to handle some of the workload."
To get an actual percentage and engine-level detail on Apple Silicon, drop into Terminal instead and run sudo powermetrics --samplers gpu_power. It reports live GPU utilization and power draw, which is close enough to Task Manager's per-engine view to make the same decode-versus-compute call, though it takes a command line instead of a checkbox.
| Platform | Tool | What it actually shows | Limitation |
|---|---|---|---|
| Windows | Task Manager > Performance > GPU | Per-engine graphs: 3D, Compute, Video Decode, Video Encode, Copy | You have to manually switch a graph to Video Decode, it isn't shown by default on every driver |
| Windows | GPU-Z | Per-sensor load including video engine load on supported cards | Third-party, not bundled with Windows |
| macOS | Activity Monitor > GPU History | Single aggregated bar graph per GPU | No percentage number, no per-engine split |
| macOS (Apple Silicon) | sudo powermetrics --samplers gpu_power | GPU utilization percentage and power draw | Terminal only, no GUI |
A GPU running at 99 percent on the wrong engine helps you exactly as much as a GPU running at 0 percent. Neither one is rendering your timeline. Check which engine is actually busy before you spend money on hardware or hours on settings.
Is this a decode bottleneck from H.264 or H.265 footage?
If Video Decode was the engine pegged in the check above, you've found the most common cause of this exact symptom, and it has nothing to do with how powerful your GPU actually is.
H.264 and H.265 are long-GOP codecs, which means most frames in the file aren't complete images, they're instructions for how to reconstruct a frame from the ones around it. That's brilliant for file size and terrible for real-time scrubbing, because Resolve has to fully rebuild each frame before it can show you a single pixel. Video post-production professional Richard Lackey lays out the mechanism in his guide to why AVC and HEVC footage needs transcoding, quoting DaVinci Resolve's own documentation directly: "The compressed data needs to be decompressed to the full RGB per pixel bit depth that can use four times or more processing power." Lackey adds the part that explains why this hits some machines harder than others: "Decoding AVC or HEVC in real time is dependent on your CPU performance, and if your GPU and software support hardware acceleration." Without that hardware support, "it's still a problem for many on laptops and lower power systems to do this in real time."
Here's the part that surprises people who assume a bigger GPU always helps: not every GPU decodes these formats in hardware, and the split isn't intuitive. Matt Bach at Puget Systems ran independent tests across GPU generations, published in Puget Systems' breakdown of H.264 and H.265 hardware decoding support in DaVinci Resolve Studio, and the results cut against the usual "NVIDIA wins" assumption:
| GPU family | H.264/H.265 hardware decode in Resolve Studio |
|---|---|
| AMD Radeon 5000, 6000, 7000 series | Both codecs, 8-bit and 10-bit, 4:2:0 and 4:2:2; H.265 12-bit variants too |
| NVIDIA RTX 20, 30, 40 series | None supported in Bach's testing |
| NVIDIA RTX 50 series | Support added starting in DaVinci Resolve Studio 20 Public Beta 1 |
| Intel Arc A/B series | None supported |
| Integrated graphics (Quick Sync, Ryzen iGPU) | None supported across tested configurations |
Bach's article is careful to note this isn't a permanent map: "not all 'flavors' of these codecs are supported depending on the bit depth and chroma subsampling used," meaning the exact same H.265 codec name can decode in hardware for one clip and fall back to software for another shot on a different camera, with different chroma subsampling, from the exact same card.
To confirm hardware decode is actually active for your specific footage rather than assuming it, Puget Systems' Peter Emery lays out a direct test in his guide to checking hardware-accelerated decoding in DaVinci Resolve: export a short test clip with hardware decode disabled in Preferences, time it, then re-enable it and export again. A "notable time decrease" confirms hardware decode is working for that footage; similar times either way mean it isn't, regardless of what the checkbox says.
If your GPU and footage combination doesn't support hardware decode, or you're on the free edition where Studio's Decode Options panel doesn't exist on Windows and Linux, you have two real fixes:
- Enable hardware decode if you're on Studio. Go to Preferences > System > Decode Options, check "Decode H.264/H.265 using hardware acceleration," and select your GPU vendor. Requires at least 4GB of VRAM and a supported codec flavor.
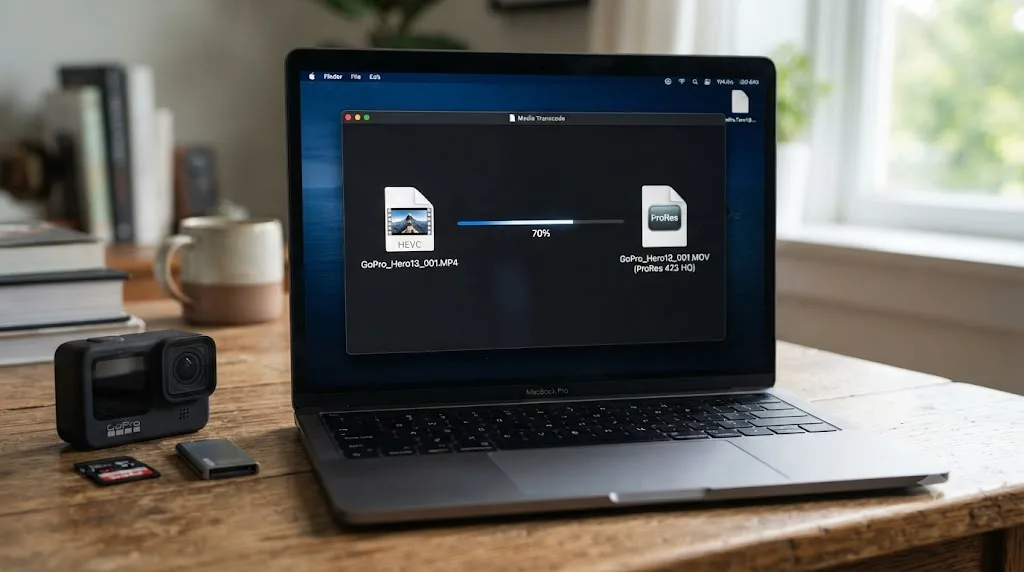
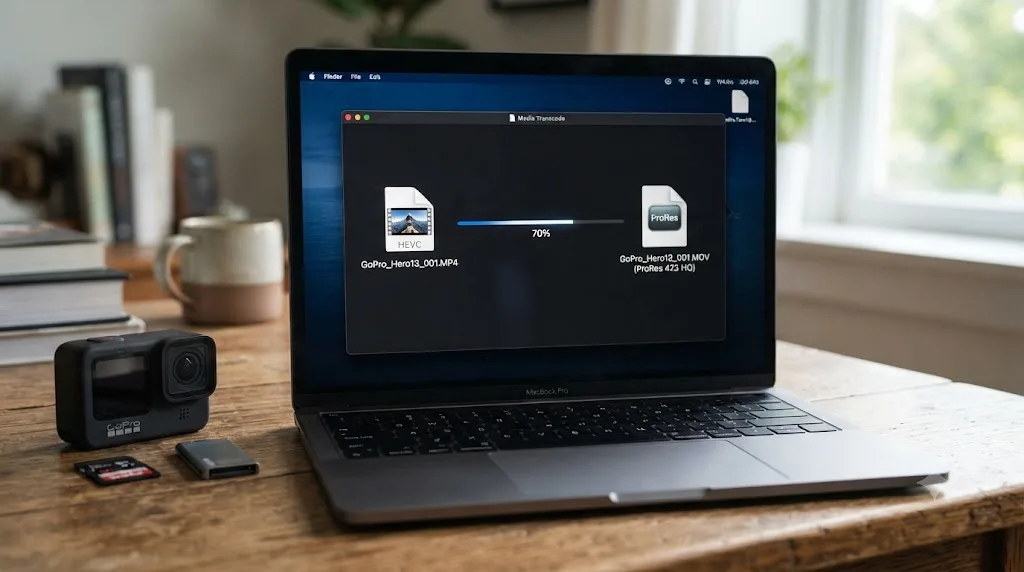
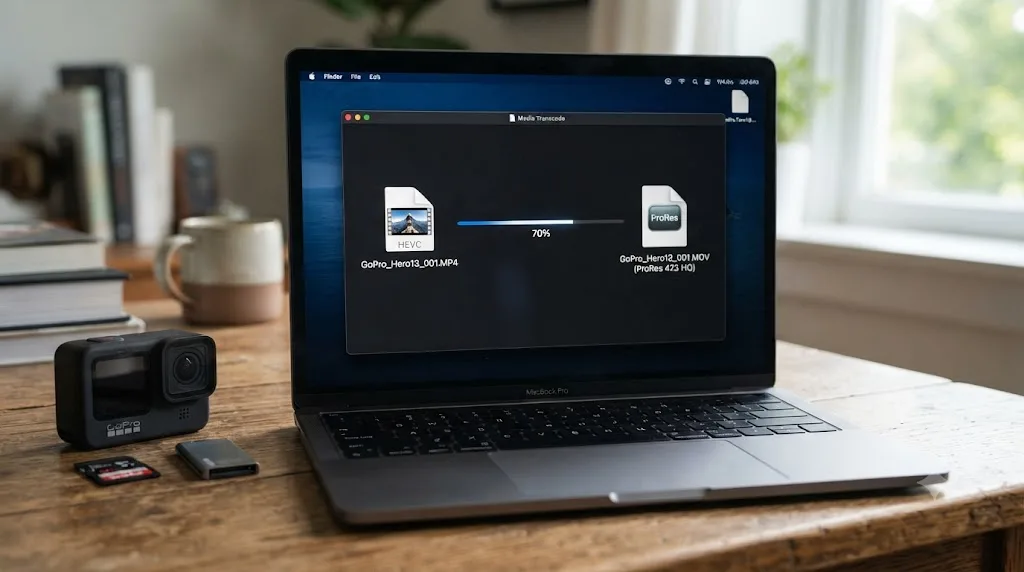
- Transcode to an intermediate codec. Generate Optimized Media, or manually transcode to ProRes or DNxHR, moves the decode cost to a one-time background job instead of paying it on every single playhead move. Lackey's framing of the tradeoff is direct: the resulting files "will be larger, but since all the decoding of the source files has been done, Resolve no longer has to rely on the CPU to do it in real-time."
Long-GOP footage does not get faster because your GPU is powerful. It gets faster only when your specific GPU is confirmed to decode that specific codec flavor in hardware. Check the table before you assume a new graphics card will fix a decode bottleneck it might not even touch.

Is this a compute bottleneck from Optical Flow, noise reduction, or Fusion?
If it was 3D or Compute that was pegged, not Video Decode, stop looking for a hidden problem. There's a real chance nothing is wrong at all.
Some of Resolve's most useful features exist specifically to consume as much GPU as you'll give them, because more compute is what makes them better. Optical Flow analyzes motion between frames to synthesize new ones for smooth retiming, and the DaVinci Resolve manual's Optical Flow section documents its Enhanced Similarity and Speed Smoothness controls as tunable exactly because the underlying analysis is expensive by design, not by accident. Temporal noise reduction compares multiple frames to isolate and remove grain, which means it's touching several full-resolution frames at once for every single output frame. Fusion nodes stack compositing operations, sometimes dozens deep, each one a separate GPU pass.
| Feature | Why it's GPU-heavy | What low FPS with it enabled actually means |
|---|---|---|
| Optical Flow (Speed Smoothness, Enhanced Similarity) | Analyzes motion vectors across frames to synthesize new in-between frames | Working correctly; frame rate scales with footage complexity and resolution |
| Temporal noise reduction | Compares multiple full-resolution frames per output frame | Working correctly; heavier on 4K and higher than on 1080p |
| Spatial (AI) noise reduction | Runs a neural network pass per frame | Working correctly; costs more than temporal alone when both are stacked |
| Magic Mask | Runs object segmentation per frame in real time | Working correctly; scales with subject count and motion |
| Multi-node Fusion comps | Each node is a separate GPU compositing pass | Working correctly; frame rate drops roughly with node count and resolution |
None of these are bugs. They're the tradeoff you accepted the moment you enabled them. The diagnostic question isn't "why is my GPU maxed with this on," it's "does frame rate recover the instant I turn it off." Disable Optical Flow, or temporarily bypass the noise reduction node, or toggle off the heaviest Fusion nodes one at a time, and watch the frame rate counter. If it snaps back immediately, your GPU was doing exactly what you asked it to, just not fast enough to do it in real time on this specific hardware.
Your real options at that point aren't about fixing a broken setting, they're about a tradeoff:
- Lower Timeline Proxy Resolution to Half or Quarter while you're editing, then switch back to Full for review and delivery. This cuts the pixel count Optical Flow, noise reduction, and Fusion all have to process, often by 75% at Quarter res.
- Render a Smart Bin or clip-level cache for the heaviest sections so playback reads from disk instead of recomputing the effect every single time the playhead crosses it.
- Accept non-real-time playback while editing and only switch heavy settings on for final review passes, treating them as a Deliver-page concern rather than an Edit-page one.
- Upgrade the GPU, which is the only option on this list that actually raises your compute ceiling rather than working around it.
Optical Flow and temporal noise reduction are supposed to max out your GPU. That is not a bug, that is the feature working as designed. If frame rate recovers the instant you turn one off, you were never troubleshooting a problem, you were pricing out a tradeoff.
Is VRAM the real ceiling?
There's a third pattern that looks like the compute case but isn't, and it's the quietest one on this page because Resolve rarely announces it directly.
According to DaVinci Resolve Club's guide to slow playback causes, when a project's working set starts to exceed available VRAM, Resolve doesn't crash or throw a clear warning first. Instead, it degrades gracefully in a way that's easy to misread as a compute problem: "When GPU memory gets tight, Resolve typically doesn't crash. It slows cache processing and waveform generation first." That's exactly the kind of slowdown that shows up as "high GPU usage, low FPS," because your GPU is still busy, just busy shuffling data in and out of memory instead of rendering frames forward.
The same guide names the specific feature that tends to expose this first: "Temporal noise reduction is one of the heavier features here. If playback drops specifically when you turn it on, that's VRAM pressure, not a broken setting." That's a useful, specific tell. If disabling temporal noise reduction on a high-resolution timeline restores frame rate instantly, and your GPU wasn't obviously underpowered for the task otherwise, the fix isn't a settings hunt, it's freeing memory.
How much VRAM is actually enough depends heavily on what you're asking Resolve to do at once. A guide to GPU selection for editors, Coremicro's breakdown of GPU recommendations for DaVinci Resolve Studio, puts a specific floor on the features covered above: "If you use Magic Mask, temporal noise reduction, or Fusion compositing regularly, target at least 16 GB of VRAM." Below that ceiling on a demanding timeline, the same guide warns, you see stuttering playback, failed effects, and memory errors once capacity is genuinely exceeded, not gracefully but suddenly.
Practical ways to relieve VRAM pressure without buying a new card:
- Close every other GPU-heavy application. Browsers with hardware acceleration enabled, screen recording software, and other creative apps all share the same VRAM pool as Resolve.
- Lower Timeline Proxy Resolution, the same fix that helps a pure compute bottleneck, since it directly shrinks the frame buffer size Resolve has to hold in memory.
- Reduce simultaneous heavy effects on one clip. Stacking temporal noise reduction, Magic Mask, and a Fusion comp on the same frame multiplies memory pressure rather than adding it.
- Check your render cache settings under Playback > Render Cache. A cache set too aggressively on limited VRAM can compete with playback for the same memory it's trying to save you from recomputing.
Insufficient VRAM does not announce itself. It just makes everything downstream of it slower, quietly, until you disable one feature and watch the frame rate jump back. That jump is your diagnosis.
Is GPU Processing Mode set wrong?
There's a setting that can produce this exact symptom on hardware that should have no trouble at all, and it hides in plain sight because it defaults to something that usually works, which is precisely why nobody checks it.
DaVinci Resolve Club's playback guide describes the default behavior directly: "GPU Processing Mode defaults to Auto, which usually lands on the right choice: CUDA for Nvidia cards, OpenCL or Metal depending on your platform for AMD." The failure mode is quiet rather than dramatic: "However, when Auto picks wrong, or a driver update breaks that detection, playback can degrade without any error message, just a quiet drop in frame rate." No dialog, no warning, just your GPU working through a less efficient processing path while still showing high utilization, because it's genuinely busy, just less productive per cycle than the correct backend would be.
| Platform and GPU | Correct manual mode | Wrong mode symptom if Auto misdetects |
|---|---|---|
| Windows or Linux, NVIDIA GPU | CUDA | Falls back to OpenCL, higher usage for lower throughput |
| Windows or Linux, AMD GPU | OpenCL | Rare, but possible on mixed-GPU systems with an integrated chip also present |
| macOS, any GPU | Metal | Almost never misdetects on modern macOS, worth checking after a major OS update regardless |
To check and fix it manually:
- Open Preferences > System > Memory and GPU.
- Look at GPU Configuration. If Auto is checked and you suspect a mismatch, uncheck it.
- Manually select CUDA for NVIDIA, Metal on a Mac, or OpenCL for AMD.
- Restart Resolve and retest the same timeline that was struggling.
This is a five-minute check with no downside, and it's worth doing right after any GPU driver update, any macOS update, or any time you've added a second GPU to the system, since all three are common triggers for Auto detection to land somewhere it shouldn't.
Is your laptop thermal throttling under load?
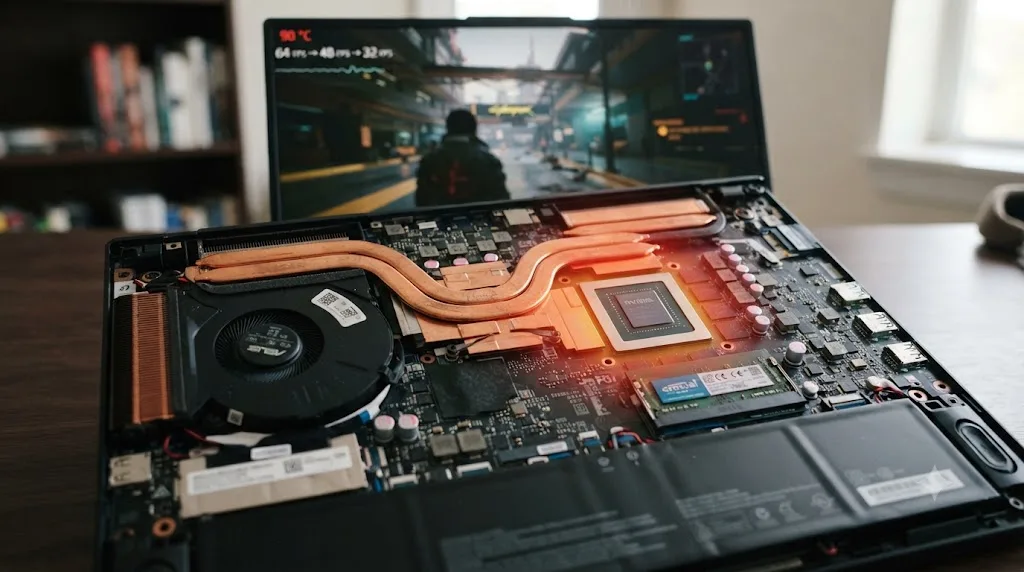
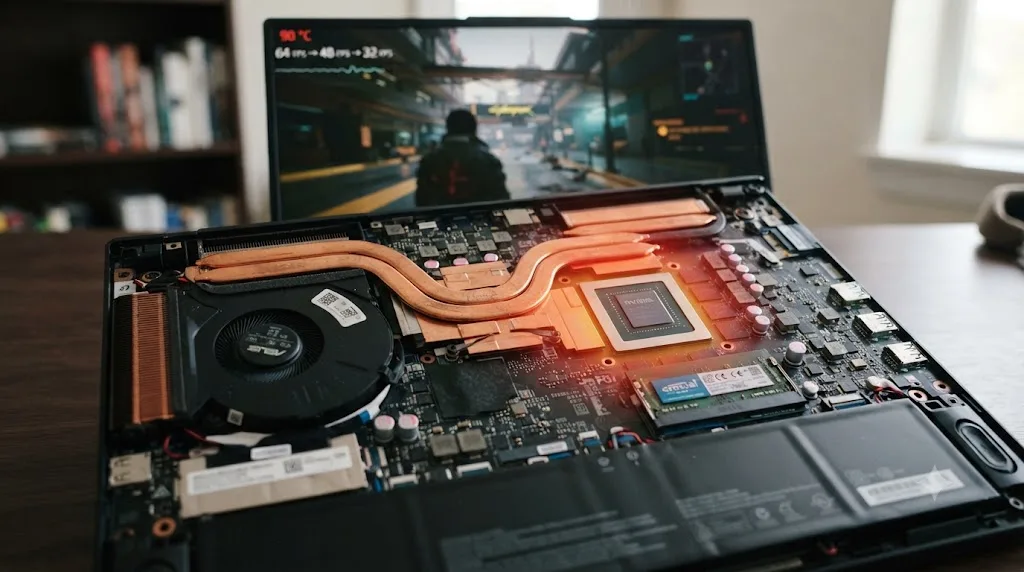
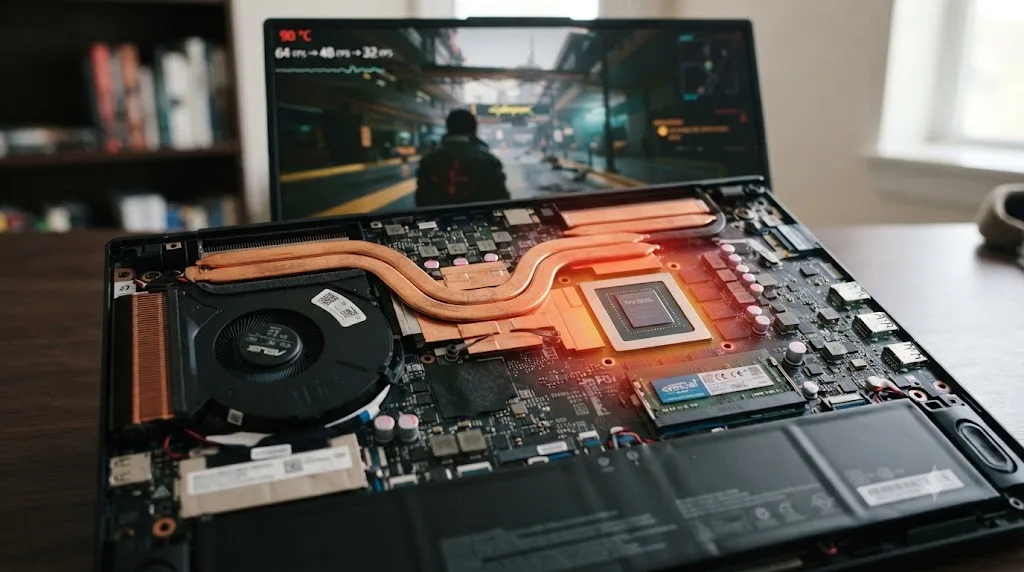
If you're on a laptop and none of the above fully explains it, there's a mechanical answer hiding underneath the software one: your GPU might be reporting high usage while actually doing less work than that number implies, because usage measures how much of the time it's busy, not how fast it's running while busy.
Thermal throttling is real, well documented, and specific to sustained workloads rather than short bursts, which is exactly why a quick benchmark can look fine while a real editing session doesn't. A guide to laptop cooling that specifically references creative rendering workloads, KryoZon's guide to cooling laptop chips with ThrottleStop, lays out the temperature mechanics: "modern laptop CPUs can reach 45W to 65W TDP values in performance modes, and thermal throttling typically appears around 95°C to 105°C junction temperatures." Laptop GPUs share the same chassis, the same fans, and often the same heat pipes as the CPU, so the same thermal ceiling applies to sustained GPU-heavy work.
The guide's testing methodology is worth borrowing directly for your own diagnosis, since a short test genuinely won't catch this: "Use the real workload that overheats the laptop, such as a 30-minute game, a 45-minute export, or a 20-minute Cinebench R23 loop." A five-second scrub test tells you nothing about throttling. A sustained fifteen to twenty minute playback or export session does, because throttling is a heat accumulation problem, not an instant-load problem.
How to check if this is your actual cause:
- Play or export your heaviest timeline continuously for 15-20 minutes, not just a quick test.
- Watch whether frame rate starts high and degrades over that window, rather than being consistently low from the first second.
- If you have a GPU temperature monitor, watch whether temperature climbs toward the 95-105°C range and frame rate drops in step with it.
- If frame rate recovers after the laptop sits idle for a few minutes to cool, thermal throttling is confirmed.
Fixes that actually help, roughly in order of how much control you have over them:
- Use a laptop cooling pad or elevate the back of the laptop to improve intake airflow, the cheapest fix and often surprisingly effective.
- Set your power plan to plugged-in, performance mode, since battery-saving profiles on Windows and macOS both cap GPU clocks well below what the hardware can sustain.
- Clean intake and exhaust vents. Dust buildup is one of the most common, most overlooked causes of a laptop that used to run fine and now throttles under the same workload.
- Undervolt carefully, if your specific chip supports it, using the actual workload that overheats it for validation rather than a generic stress test, exactly as the ThrottleStop guide recommends.
A GPU that reads 100 percent usage while throttled is doing less work per second than the same GPU at 100 percent usage running cool. That's the part a usage percentage alone will never show you, and it's why two laptops with the identical spec sheet can deliver very different frame rates on the exact same project.
Is something else competing for your GPU?
Resolve doesn't have exclusive access to your GPU just because it's the app in focus. Anything else running that also touches the GPU is sharing the exact same engines you're trying to diagnose.
Common competitors worth ruling out before you assume Resolve itself is the problem:
- Browsers with hardware acceleration enabled. Chrome, Edge, and others increasingly offload video decode and even some rendering to the GPU by default, and a dozen open tabs with autoplaying video can eat real decode-engine capacity.
- Screen recording or streaming software, OBS being the most common, actively encodes in real time using the same GPU encode engine Resolve's Deliver page needs.
- A second monitor at high resolution or refresh rate, especially 4K at 120Hz or higher, which consumes a real, constant slice of GPU output bandwidth just to drive the display, separate from any editing work.
- Background render or export jobs left running from a previous session, or a render queue you forgot was still processing in the background.
- A second, unused GPU in a multi-GPU system that Resolve isn't actually using for compute but that Windows is still polling, which occasionally shows up as unexplained activity on system monitoring tools.
The check here is simple: close everything non-essential, retest the same timeline, and see whether frame rate changes. If it does, you've found a competing process rather than a Resolve-specific problem, and the fix is closing that application, not changing a single setting inside Resolve.
Does this look different on NVIDIA, AMD, and Apple Silicon?
The underlying causes on this page apply everywhere, but which one you're most likely to hit shifts by platform, mostly because of the decode support gap covered earlier.
| Platform | Most likely cause of this symptom | What to check first |
|---|---|---|
| Windows, NVIDIA RTX 20/30/40 series | Decode bottleneck on H.264/H.265, since Puget's testing found no hardware decode support on these generations | Task Manager's Video Decode graph, then transcode or generate optimized media |
| Windows, NVIDIA RTX 50 series | Compute bottleneck or VRAM pressure, since decode support was added in Resolve Studio 20 beta | Optical Flow, temporal noise reduction, and VRAM headroom first |
| Windows, AMD Radeon 5000-7000 series | Compute bottleneck or thermal throttling, since decode is well supported here | Heavy Fusion nodes, noise reduction, or sustained-load throttling on laptops |
| macOS, Apple Silicon | Compute bottleneck, VRAM (unified memory) pressure, or GPU Processing Mode after an OS update | Activity Monitor plus powermetrics, then Metal mode confirmation |
Apple Silicon deserves one specific note: its unified memory architecture means GPU and system RAM share the same pool, so "VRAM pressure" on a Mac isn't a separate, dedicated pool running out, it's your total system memory being squeezed by Resolve, your OS, and everything else open at once. The fix is the same in principle, lower resolution, close competing apps, reduce simultaneous heavy effects, it just draws from one shared number instead of a GPU-specific one.
Neither NVIDIA nor AMD nor Apple Silicon is immune to this symptom, but the specific branch each one lands on tends to follow its decode support and memory architecture, not just its raw compute power. Knowing your platform's likely culprit saves you from testing five branches when your hardware only realistically produces two of them.
Does the free version behave differently than Studio?
Partially, and the difference matters for which fixes are even available to you.
The compute-bound causes are identical on both editions. Optical Flow, Fusion compositing, and the free version's own noise reduction tools all draw on the same GPU compute engine the same way, and neither edition gets a compute advantage or penalty for being free or paid. If your GPU is maxed on real render work, that's true regardless of which edition you're running.
The decode side is where the editions genuinely split. DaVinci Resolve Studio exposes hardware decode acceleration for H.264 and H.265 through Preferences > System > Decode Options, letting a supported GPU take that work off the CPU entirely. The free edition doesn't have that panel on Windows and Linux, according to multiple independent troubleshooting guides, including Beginners Approach's walkthrough of enabling GPU acceleration in DaVinci Resolve, which notes the free version relies on the CPU for this decode work instead. On a Mac, the free edition does get some decode acceleration through the OS's own media frameworks, since that path isn't gated the same way Resolve's own Studio-specific decode panel is.
Practically, this means a free-edition editor hitting a decode bottleneck on Windows won't see it as a misleading GPU reading at all, since the GPU genuinely isn't involved in that decode. They'll see it as CPU load instead, with the GPU sitting comparatively idle. The fix is the same either way, generate optimized media or transcode to an intermediate codec, but the diagnostic path differs: check CPU usage first on free-edition Windows or Linux, check GPU per-engine graphs first on Studio.
| Free edition | Studio | |
|---|---|---|
| Optical Flow, Fusion, noise reduction GPU load | Identical | Identical |
| H.264/H.265 decode on Windows/Linux | CPU only | GPU hardware decode available on supported cards |
| H.264/H.265 decode on macOS | Partial OS-level acceleration | Full hardware decode support via Decode Options |
| GPU Processing Mode setting | Available | Available |
| VRAM pressure behavior | Identical | Identical |
Two worked examples, start to finish
Reading through eight branches is a lot to hold in your head at once. Here's how two different editors actually walked through this, in the order the checks above would realistically happen.
Example one: the decode bottleneck. A YouTuber edits footage straight off their phone, H.265, 4K, 60fps, on a desktop with a mid-range NVIDIA RTX 4070. Straight cuts play fine. The moment they scrub through raw phone footage before any color grading is even applied, GPU usage jumps to 97% and playback drops to roughly 6fps. They open Task Manager, switch one graph to Video Decode, and watch it pin at 100% while the 3D graph barely registers. Checking Puget Systems' hardware decode table confirms their exact GPU generation, RTX 40 series, has no tested hardware decode support for this codec. They generate Optimized Media for the affected clips, converting them to DNxHR on import, and playback jumps to a smooth 60fps immediately, with GPU usage on the 3D graph rising as expected during actual color work and Video Decode dropping to near zero, since the optimized files no longer need real-time decompression at all.
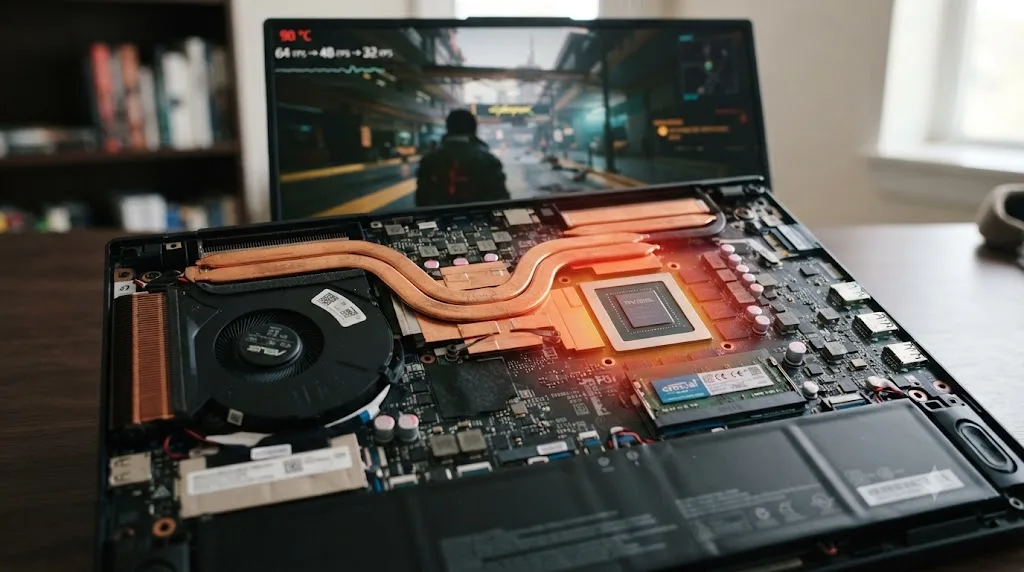
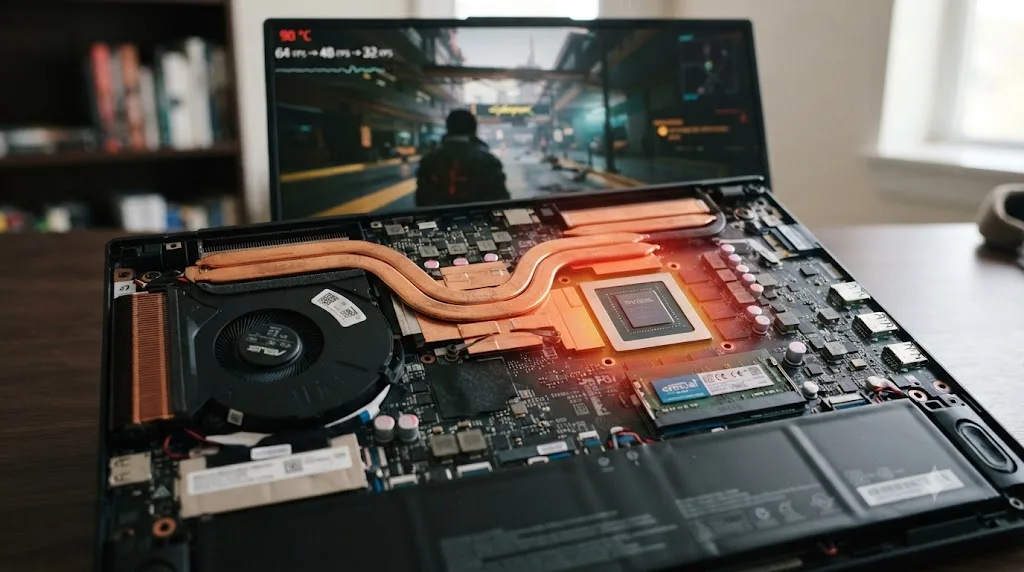
Example two: the throttling laptop. A colorist grades a wedding video on a 2024 gaming laptop with a mobile RTX GPU, applying moderate noise reduction across most clips. The first five minutes of a session feel snappy, full frame rate, GPU reading a reasonable 70-80%. Twenty minutes into a long grading pass, playback has degraded to a stutter, and GPU usage now reads 100%, higher than when things felt fast. They test the theory: close the laptop lid for ten minutes to let it cool, plug into a cooling pad, and set Windows' power plan to Best Performance while plugged in. Frame rate recovers fully for another fifteen to twenty minutes before degrading again on the same curve. That repeatable pattern, fine when cool, degrading over time under sustained load, confirmed thermal throttling rather than a settings problem, and the longer-term fix became scheduling grading sessions with breaks and investing in better laptop cooling rather than chasing a Resolve setting that was never actually broken.
Neither editor needed new hardware to fix their specific problem. One needed a one-time transcode. The other needed airflow and a different expectation for what a laptop can sustain over an hour versus five minutes.
Quick reference: symptom, cause, and fix
Match your actual symptom to a row before changing anything, since several of these look identical from the GPU usage meter alone but need completely different fixes.
| Symptom | Likely cause | Fix |
|---|---|---|
| Video Decode engine graph pegged, 3D/Compute low | Decode bottleneck, unsupported H.264/H.265 flavor on your GPU | Enable hardware decode in Preferences (Studio), or generate optimized media/transcode |
| 3D or Compute engine graph pegged, Video Decode low | Genuine compute load from Optical Flow, noise reduction, or Fusion | Lower Timeline Proxy Resolution, disable the heaviest feature while editing, or accept the tradeoff |
| Frame rate drops specifically when temporal noise reduction is enabled | VRAM pressure | Lower proxy resolution, close other GPU-heavy apps, reduce stacked effects |
| Playback degraded silently after a driver update or new GPU, no error shown | GPU Processing Mode Auto detection picked the wrong backend | Manually set CUDA, Metal, or OpenCL in Preferences > System > Memory and GPU |
| Frame rate starts strong and degrades over 15-20 minutes on a laptop | Thermal throttling | Cooling pad, performance power plan while plugged in, clean vents, careful undervolt |
| GPU usage changes when closing background apps | Something else competing for the same GPU engine | Close browsers with hardware acceleration, screen recorders, background renders |
| Consistent gap between NVIDIA and AMD on the same codec | Hardware decode support genuinely differs by GPU generation and vendor | Check Puget Systems' tested decode support table for your specific GPU |
| Free edition, Windows or Linux, CPU pegged instead of GPU on H.265 footage | Free edition has no GPU decode acceleration on this platform | Generate optimized media or transcode, since the hardware decode toggle doesn't exist for you |
The verdict
High GPU usage and low FPS in DaVinci Resolve is never one problem wearing different disguises. It's a handful of genuinely distinct causes that all happen to trip the same usage meter: a decode engine maxed on footage your GPU can't hardware-accelerate, a compute engine legitimately working as hard as the feature you enabled demands, VRAM running out quietly before anything crashes, a misdetected processing mode, a throttling laptop, or something else entirely eating the same GPU you're trying to diagnose.
Check per-engine graphs before you check anything else. That single habit, Video Decode versus 3D or Compute on Windows, powermetrics alongside Activity Monitor on a Mac, tells you within two minutes which half of this page actually applies to you, and it rules out the other half without you touching a single setting you didn't need to touch.
TryUncle is the on-screen assistant for DaVinci Resolve on macOS, ask in plain words and Uncle points at the exact control on your screen, and that's exactly the kind of moment it's built for once your hardware itself is behaving normally, the "wait, which setting was that again" second-guessing that eats an editing session even after your GPU is doing exactly what it should. It's a paid app at $34.99 a month, cancel anytime. It's also worth knowing where it fits against the rest of the field: tools like Sottocut and cutagent.ai automate the edit itself, and chat-based helpers like heyeddie.ai answer questions in a side panel, while Uncle watches your actual screen inside Resolve and points at the control live, closer to a tutor standing behind you than either an autopilot or a chatbot.
If your bottleneck turned out to be a decode issue on H.264 or H.265 footage specifically, our guide on DaVinci Resolve's mixed frame rate timeline jitter covers a closely related conform problem that shows up on the same kind of mismatched footage, with its own separate fix. If you're on Windows with an NVIDIA card and you're seeing outright crashes rather than just slow playback, our fix for DaVinci Resolve NVIDIA driver crashes covers the Game Ready versus Studio Driver split that causes a different, more severe version of GPU trouble. And once your hardware is confirmed healthy and you just want your whole workflow to move faster day to day, how to edit faster in DaVinci Resolve picks up from exactly where this guide leaves off.
Frequently asked questions
- Why does DaVinci Resolve show 99% GPU usage but still run at a low frame rate?
- Two different things produce this exact symptom, and they need opposite fixes. Either your GPU is genuinely maxed on real work, Optical Flow, temporal noise reduction, a heavy Fusion comp, and 99% usage is an honest report of a chip working as hard as it can. Or your GPU's video decode engine is pegged decoding a long-GOP H.264 or H.265 clip while the compute engine that actually renders your color and effects pipeline sits mostly idle, and Task Manager reports the busiest engine as your overall GPU usage, hiding that split. Checking per-engine graphs, not the single aggregate percentage, is what tells you which one you have.
- How do I tell if it's a decode bottleneck or a compute bottleneck in DaVinci Resolve?
- On Windows, open Task Manager's Performance tab, click your GPU, and change one of the four graphs to Video Decode instead of the default 3D. If Video Decode is pegged near 100% while 3D and Compute sit low, you have a decode bottleneck, most likely H.264 or H.265 footage without hardware decode support on your specific GPU. If 3D or Compute is the one maxed out, your GPU is genuinely working on the render pipeline itself, which points at Optical Flow, noise reduction, or Fusion nodes instead. On a Mac, Activity Monitor's GPU History window only shows one aggregated graph, so pair it with Terminal's `sudo powermetrics --samplers gpu_power` for a percentage breakdown, or just test the theory directly by disabling noise reduction or Optical Flow and watching whether frame rate recovers.
- Does enabling hardware decode fix high GPU usage with low FPS in DaVinci Resolve?
- It fixes the decode-bottleneck version of this problem, and only on GPUs that actually support hardware decoding for your exact codec, bit depth, and chroma subsampling. Puget Systems' testing found AMD Radeon 5000, 6000, and 7000 series cards decode both H.264 and H.265 in the flavors Resolve commonly uses, while NVIDIA's RTX 20, 30, and 40 series cards accelerated none of the formats tested, with RTX 50 series support only added in DaVinci Resolve Studio 20's first public beta. The setting lives in Preferences > System > Decode Options, and it's Studio-only, the free version decodes H.264 and H.265 on the CPU on Windows and Linux.
- Is high GPU usage in DaVinci Resolve always a bad sign?
- No, and this is the single most common misread of the symptom. Temporal noise reduction, Optical Flow retiming, Magic Mask, and multi-node Fusion comps are all designed to use as much of your GPU as they can get, because more GPU throughput is exactly what makes those features finish a frame faster. Seeing 90 to 100% GPU usage while one of those is active is the feature working correctly. The problem case is low FPS with high usage on a timeline that shouldn't be demanding, simple color grading, a cuts-only edit, footage with no heavy effects, since that pattern points at a decode bottleneck or a misconfigured setting instead of legitimate compute load.
- Can not having enough VRAM cause high GPU usage with low FPS?
- Yes, and it's one of the quieter causes because Resolve doesn't throw a clear out-of-memory error first. When available VRAM gets tight, Resolve slows its own cache processing and waveform generation before anything crashes, which shows up as your GPU reading busy while frame rate drops. Temporal noise reduction is one of the heavier VRAM consumers, so if playback tanks specifically when you enable it on a high-resolution timeline, that's a strong sign you're VRAM-limited rather than looking at a broken setting. Lowering Timeline Proxy Resolution or closing other GPU-heavy apps frees headroom without touching your actual GPU.
- Does high GPU usage with low FPS happen more on laptops than desktops?
- It shows up more often on laptops, but for a different reason than raw GPU power. A laptop GPU can report 100% usage while running at a throttled clock speed well below its rated boost, because usage measures how much of the time the chip is busy, not how fast it's actually completing work at that moment. Thermal throttling on sustained creative workloads typically starts appearing around 95 to 105 degrees Celsius junction temperature on modern mobile chips, according to cooling research cited by hardware tuning guides, so a laptop that handles a five-minute test clip fine can visibly slow down twenty minutes into a real export or a long grading session as it heats up.
- Does the free version of DaVinci Resolve show this same high GPU usage low FPS behavior as Studio?
- The compute-bound causes, Optical Flow, Fusion, and the free version's built-in noise reduction, behave the same way on both editions, since neither is gated behind the paid tier for GPU load. The decode side differs though: DaVinci Resolve Studio can hand H.264 and H.265 decoding to supported GPUs through Preferences > System > Decode Options, while the free version decodes those codecs on the CPU on Windows and Linux, which means a decode bottleneck on free-edition Resolve shows up as CPU load rather than a misleading GPU reading, and the fix is proxies or optimized media rather than a hardware decode checkbox that doesn't exist for you.
Sources
- What H.264 and H.265 Hardware Decoding is Supported in DaVinci Resolve Studio?, Puget Systems (Matt Bach)
- Is Your Footage Hardware Accelerated in DaVinci Resolve?, Puget Systems (Peter Emery)
- AVC / H.264 / HEVC and DaVinci Resolve: Why You Need to Transcode, Richard Lackey
- GPUs in the Task Manager, Microsoft DirectX Developer Blog
- DaVinci Resolve Slow Playback: Lag, Stutter, Dropped Frames, DaVinci Resolve Club
- Hardware Recommendations for DaVinci Resolve, Puget Systems
- How to Make DaVinci Resolve Use GPU (Helpful Tips!), Beginners Approach
- Best GPUs for DaVinci Resolve Studio (2025-2026 Guide), Coremicro
- An Easy Way to Monitor GPU Activity, Larry Jordan
- View GPU Activity in Activity Monitor on Mac, Apple Support
- How to Cool Down Laptop CPUs With ThrottleStop Safely, KryoZon
- Optical Flow [OF], DaVinci Resolve Manual (mirrored)
Learn by doing, not watching
Stop translating tutorials to your timeline.
TryUncle stays beside Resolve on Mac and Windows. When you ask, Uncle sees your screen and points at the exact control you need. No hunting through tabs, timestamps, or mismatched tutorials.
Meet TryUncleKeep reading
 FixesJul 17, 202627 min read
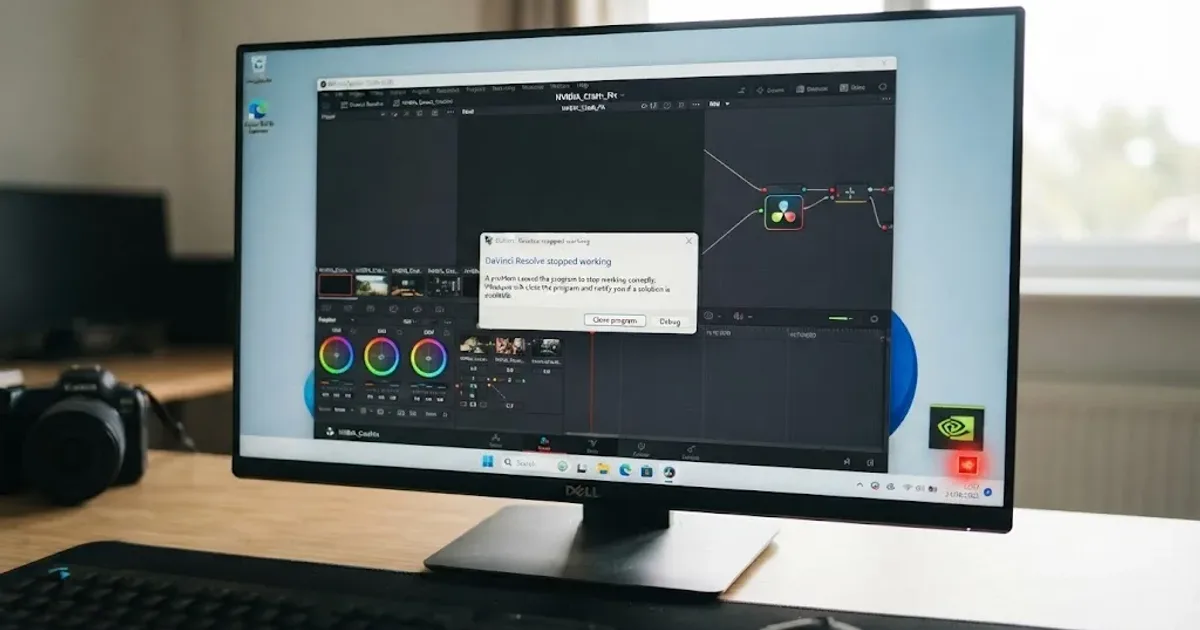
DaVinci Resolve NVIDIA Driver Crash on Windows: The Real Fix
DaVinci Resolve crashing on Windows with an NVIDIA GPU almost always traces to the Game Ready vs Studio Driver split. Here's the diagnosis and every fix branch.
 FixesJul 12, 202629 min read
DaVinci Resolve Mixed Frame Rate Timeline Jittery: The Fix
DaVinci Resolve timeline jitters when clips have mixed frame rates. Here's why it happens, the setting that locks after import, and every real fix.
 GuidesJul 15, 202638 min read
How to Edit Faster in DaVinci Resolve: A Workflow Guide
The workflow fixes that actually speed up DaVinci Resolve editing: proxy media, render cache, GPU/decode settings, hardware controllers, batch tools, and where AI helps.